Decoding Net Zero: Introduction to Climate Change

On Tuesday, July 4, 2023, a significant milestone was reached as Earth experienced its hottest recorded day with a global average temperature soaring to a staggering 17.18 degrees Celsius. This alarming record serves as a stark reminder of the pressing issue we face: climate change.

There have been significant commitments from financial firms managing a staggering $130 trillion in assets to reach net-zero emissions by 2050, but the lack of clear standards for defining “green” measures has led to challenges in comparing sustainable finance efforts.

Climate change itself is a complex phenomenon that encompasses the ongoing increase in global temperatures and its effects on the Earth’s climate system. It can be caused by both human activities and natural factors such as—solar and volcanic activity, climate change feedbacks: self-inforcing or positive feedback e.g. sea and ice albedo, wildfires, aerosols, and clouds. The scientific consensus attributes the majority of the observed climate change to human activities and the associated increase in greenhouse gas (GHG) emissions. Multiple datasets confirm that the climate system is warming, with the past decade experiencing a significant temperature increase. Surface temperatures are rising by about 0.2 °C per decade, and in 2020, it surpassed 1.2 °C above pre-industrial levels.

Quick Facts

  • Climate change is not the only critical environmental impact
  • GHGs comprise less than 1% of the atmosphere
  • CO2 makes up only about 0.04% of the atmosphere
  • The atmosphere of Earth contains 78% nitrogen, 21% oxygen, 0.9% argon, and 0.1% other gases
  • This excludes water vapor which can be up to about 4% (hot, humid air masses) of the total volume
  • The largest contributor to the natural greenhouse effect is water vapor
  • Aerosol, a non-GHG suspended in air, has a second important human influence on climate. It can also have a cooling effect by scattering sunlight back into space
  • The next ice age (glacial period) has been delayed by thousands of years due to anthropogenic GHG emissions. Rise and fall of CO2: Milankovitch cycles

Why Carbon?

To understand why we are so much concerned about carbon, it needs to be understood that GHGs are the primary cause of global warming. GHGs absorb and trap (redirect back) some of the longwave radiation (heat) the planet emits.

Although many of the GHGs, such as nitrous oxides and fluorinated gases (CFCs, HCFCs, HFCs, etc) are hundreds of times more potent than carbon dioxide, it still remains the major contributor to the enhanced greenhouse effect (anthropogenic greenhouse effect) due to its higher emission rate compared to other gases.

Share of different GHGs in global emissions, Source: NRDC

The levels of greenhouse gases (GHGs) are influenced by a delicate equilibrium between sources and sinks. Certain processes generate GHGs, while natural sinks such as soil, forests, and oceans absorb and help mitigate their presence in the atmosphere.

Global warming potential (GWP) is a measure of how much a given greenhouse gas is estimated to contribute to global warming, relative to carbon dioxide.

The GWP of greenhouse gas is calculated based on its ability to absorb and re-emit thermal radiation (heat) in the Earth’s atmosphere, as well as its atmospheric lifetime (how long it remains in the atmosphere before breaking down). Greenhouse gases with a high GWP absorb and re-emit more heat, and/or remain in the atmosphere for longer periods of time, than gases with a low GWP. 

The unit kgCO2e stands for kilograms of carbon dioxide equivalent. It is a metric used to express the amount of greenhouse gas emissions in terms of the equivalent amount of carbon dioxide that would have the same global warming potential. By converting emissions of different greenhouse gases into CO2 equivalents, it becomes easier to compare and aggregate the total impact of various emissions sources. This unit simplifies the communication and analysis of emissions data across different gases.

Some examples of greenhouse gases and their global warming potentials (over a 100-year time horizon) are: 

  • Carbon dioxide (CO2): GWP = 1 or 1 kgCO2e
  • Methane (CH4): GWP = 25-36 0r 25 kgCO2e
  • Nitrous oxide (N2O): GWP = 298 or 298 kgCO2e
  • Fluorinated Gases (CFCs, HCFCs, HFCs, CF6, C2F6, SF6, NF3): GWP values vary, but can be as high as 23,000 or 23,000 kgCO2e

The unit kgCO2e stands for kilograms of carbon dioxide equivalent. It is a metric used to express the amount of greenhouse gas emissions in terms of the equivalent amount of carbon dioxide that would have the same global warming potential. By converting emissions of different greenhouse gases into CO2 equivalents, it becomes easier to compare and aggregate the total impact of various emissions sources. This unit simplifies the communication and analysis of emissions data across different gases.

Global Warming is not the only critical environmental impact

Global warming, although a crucial environmental concern, is not the sole factor affecting our planet. Life Cycle Assessment (LCA) provides a comprehensive perspective by considering 15 different environmental impact categories. LCA is a systematic and comprehensive methodology used to evaluate the environmental impacts of a commercial product, process, or system throughout its entire life cycle. Each impact category is measured using specific units and describes a distinct aspect of environmental impact. Some of these categories include GWP, Ozone Depletion Potential (ODP), Acidification Potential, Eutrophication, Toxicity Potential, Land & Water Use, Ionising radiation, and more.

Carbon Footprint vs Environmental Footprint

Carbon footprint is a comparative measure of greenhouse gas emissions from a defined population or activity encompassing the entire life cycle from production to consumption.

In contrast, environmental footprint considers a broader range of environmental factors beyond just emissions, including energy use, water consumption, land use, air pollution, waste generation, and resource depletion. It provides a more comprehensive assessment of overall environmental impact.

For example, when analyzing a cotton t-shirt, the carbon footprint would quantify CO2 emissions throughout its lifecycle, while the environmental footprint would consider factors like water usage, land impact, chemical usage, and waste generation. It is also important to note that there are a variety of environmental impacts associated with every plan, policy, activity, or product.

Source: Our World in Data

Carbon in Buildings

According to the 2019 report by the International Energy Agency (IEA), the buildings and construction sector represented 36% of final energy consumption and 39% of energy-related carbon dioxide (CO2) emissions. In 2018, approximately 11% of these emissions were attributed to the manufacturing of building materials and products like steel, cement, and glass.

LCA Stages in Construction as per BS EN 15978:2011, Embodied Carbon
LCA Stages in Construction as per BS EN 15978:2011

Some definitions:

  • Embodied carbon: Refers to the carbon emissions associated with the entire life cycle of a product, including the extraction of raw materials, manufacturing, transportation, construction, use, and disposal.
  • Operational carbon: Refers to the carbon emissions resulting from the energy consumed during the operation or use of a product, such as electricity or fuel used for heating, cooling, and powering appliances and any maintenance, or repair activities. Some studies have projected that embodied and operational carbon have almost 50:50 share for new construction from 2020 to 2050 (business as usual).
  • Cradle to gate: A life cycle assessment boundary that considers the environmental impacts of a product from the extraction of raw materials until it leaves the manufacturing gate. It does not include the use and disposal phases. Typically, manufacturer or industry-wide Environmental Product Declarations (EPDs) focus on providing data and information up to the “cradle to gate” stage of a product’s life cycle. This data can be valuable for comparing products and making informed decisions regarding the selection of materials or products with lower environmental impacts. However, it’s important to note that the cradle-to-gate perspective does not encompass the use, maintenance, disposal, or end-of-life phases of a product’s life cycle.
  • Cradle to grave: A life cycle assessment boundary that encompasses the entire life cycle of a product, from raw material extraction to manufacturing, construction, use, and disposal.
  • Cradle to cradle: An approach to designing and producing products in a way that considers their entire life cycle, aiming to eliminate waste and maximize recyclability or make them biodegradable.

Greenhouse Gas Protocol

The Greenhouse Gas Protocol (GHG Protocol) is the world’s most widely used greenhouse gas accounting standard. It provides a framework for organizations to measure, manage, and report their greenhouse gas emissions.

The GHG Protocol defines three scopes that categorize emissions based on their source:

  1. Scope 1 covers direct greenhouse gas emissions that occur within a company’s own boundaries. It includes emissions from activities such as fuel combustion, company-owned vehicles, and fugitive emissions.
  2. Scope 2 includes indirect greenhouse gas emissions that result from the consumption of purchased electricity, heat, cooling, or steam. These emissions are associated with the generation of the purchased energy and occur outside of the company’s boundaries.
  3. Scope 3 encompasses a broader range of indirect greenhouse gas emissions that occur as a result of a company’s value chain. This includes emissions from suppliers, product users, transportation of goods, and other indirect sources. Scope 3 emissions are often significant and can represent a substantial portion of a company’s total emissions.

There are 15 categories within Scope 3, which vary in relevance depending on the organization. Examples of Scope 3 emissions include the purchase of goods or services, employee commuting, and the use of sold products.

What are scope 1, 2, and 3 emissions? GHG
Scope 1, 2, and 3 emissions, Image Credit: certainitysoftware

While Scope 1 and Scope 2 emissions are commonly reported, Scope 3 emissions have gained increased attention as they can represent a significant portion of an organization’s overall greenhouse gas emissions. Efforts are being made to include Scope 3 emissions in greenhouse gas reporting to provide a more comprehensive understanding of a company’s environmental impact.

Stay tuned for the next installment where we will continue to explore climate change, untangle the jargon, clarify any misunderstandings, and provide insights into the practical aspects of calculating and achieving Net Zero in construction.

Set Family Type Parameters Values: Multiple Families & Multiple Parameters

Working with Type Parameters can be a bit challenging in Dynamo for beginners and on top of that working with multiple elements and their parameters. Today we are going to look at how to set the multiple type parameters for each of the various families in the project.

Type parameters are specific to a family type, and we need to obtain the family type to access its parameters. Setting parameters for multiple elements can be achieved in a similar manner.

Setting Multiple Parameter Values

Say Goodbye to Unwanted Materials in Revit: Deleting Elements with a Selection Dialogue

Revit is a powerful tool for building design and construction, but with great power comes great responsibility. Keeping your Revit projects tidy and efficient can be a daunting task, especially when it comes to purging unwanted elements. Revit does come with an out-of-the-box feature Purge Unwanted to purge items, but it doesn’t allow bulk deleting of custom-picked elements.

To solve this problem, we can turn to Dynamo, a visual programming platform that allows us to automate tasks in Revit. By creating a Dynamo script or workflow, we can first get all the materials used in the project and then let the user pick the elements or materials that need to be deleted. The script filters out the selected materials and deletes them in bulk.

List.FilterBySelection from Springs package

Delete Unwanted Materials Dynamo Graph

By creating our own Dynamo workflows around this, we can delete other unplaced elements in bulk, such as views, floor plans, sections, legends, schedules, spaces, rooms, scope boxes, imported files, and more.

By using Dynamo to automate the process of purging unwanted elements in Revit, we can save time and improve the efficiency of our workflow. So why not give it a try and see how it can streamline your Revit projects?

Python 1: Get All Materials
This piece of code retrieves all the material elements and their names in the project.

# Import the necessary packages
import clr
clr.AddReference('RevitAPI')
from Autodesk.Revit.DB import *
clr.AddReference('RevitServices')
from RevitServices.Persistence import DocumentManager

# Get the Revit document
doc = DocumentManager.Instance.CurrentDBDocument

# Get all the materials in the project
materials = FilteredElementCollector(doc).OfClass(Material)
mats = FilteredElementCollector(doc).OfClass(Material).ToElements()
# Create lists to store the material names and IDs
material_names = []
material_ids = []

# Loop through the materials and retrieve their names and IDs
for material in materials:
    material_names.append(str(material.Id) + " - " + material.Name)

# Define the outputs
OUT = mats, material_names

Python 2: Filter List

The Python 2: Filter List node is taken from the List.FilterBySelection custom node by spring nodes by Dimitar Venkov. This Python code defines a custom form with checkboxes that allow the user to select elements. The code adds references to the necessary libraries, defines a few functions, and then creates the form using the CheckBoxForm class. The form includes buttons to check or uncheck all the elements, and to save the selected elements. This code can be used in Dynamo scripts to enable user selection of elements for further processing.

#Copyright(c) 2016, Dimitar Venkov
# @5devene, dimitar.ven@gmail.com

import clr
clr.AddReference('System.Windows.Forms')
clr.AddReference('System.Drawing')
from System.Drawing import Point, Color, Font
from System.Windows.Forms import *

def tolist(obj1):
	if hasattr(obj1,"__iter__"): return obj1
	else: return [obj1]
	
def hasInd(l1, i):
	try: l1[i] ; return True
	except: return False

class CheckBoxForm(Form):
	def __init__(self, cm1):
		self.Text = "Filter By Selection"
		self.Width = 400
		self.BackColor = Color.FromArgb(40,40,40)
		self.output1 = []
		self.ControlBox = False
		self.TopMost = True
		self.FormBorderStyle = FormBorderStyle.FixedDialog
		self.StartPosition = FormStartPosition.CenterScreen
		
		self.label = Label()
		self.label.Text = cm1
		self.label.Location = Point(5, 5)
		self.label.ForeColor = Color.FromArgb(234,234,234)
		self.label.Font = Font("Calibri", 10)
		self.label.AutoSize = True
		self.Controls.Add(self.label)

		self.button1 = Button()
		self.button1.Text = 'Save Selection'
		self.button1.AutoSize = True
		self.button1.ForeColor = Color.FromArgb(234,234,234)
		self.button1.Font = Font("Calibri", 10)
		self.button1.Click += self.save
		self.Controls.Add(self.button1)

		self.button2 = Button()
		self.button2.Text = 'Uncheck All'
		self.button2.AutoSize = True
		self.button2.ForeColor = Color.FromArgb(234,234,234)
		self.button2.Font = Font("Calibri", 10)
		self.button2.Click += self.uncheckAll
		self.Controls.Add(self.button2)

		self.button3 = Button()
		self.button3.Text = 'Check All'
		self.button3.AutoSize = True
		self.button3.ForeColor = Color.FromArgb(234,234,234)
		self.button3.Font = Font("Calibri", 10)
		self.button3.Click += self.checkAll
		self.Controls.Add(self.button3)
		
		self.panel1 = Panel()
		self.panel1.Location = Point(5, 31)
		self.panel1.Width = 370
		self.panel1.BackColor = Color.FromArgb(53,53,53)
		self.panel1.ForeColor = Color.FromArgb(234,234,234)
		self.Controls.Add(self.panel1)
		
	def add_check(self, text1, y1, b1):
		self.check1 = CheckBox()
		self.check1.Text = text1
		self.check1.Location = Point(5, y1)
		self.check1.AutoSize = True
		self.check1.Font = Font("Calibri", 10)
		self.check1.Checked = b1
		self.panel1.Controls.Add(self.check1)
	
	def btn_adjust(self,y1):
		if y1 > 700:
			y1 = 700
			self.panel1.AutoScroll = True
			self.panel1.Focus()
		self.panel1.Height = y1
		self.button1.Location = Point(5,   y1 + 38)
		self.button2.Location = Point(170, y1 + 38)
		self.button3.Location = Point(275, y1 + 38)
		self.Height = y1 + 130
			
	def save(self, sender, event):
		ctrl1 = self.panel1.Controls
		count1 = ctrl1.Count
		loc = 0
		self.output1 = [c.Checked == 1 for c in ctrl1]
		#for i in xrange(count1):
		#	if ctrl1[i].Checked == 1:
		#		self.output1.append(l1[loc])
		#	else:
		#		self.output2.append(l1[loc])
		#	loc += 1
		self.Close()
	
	def uncheckAll(self, sender, event):
		ctrl1 = self.panel1.Controls
		count1 = ctrl1.Count
		for i in xrange(count1):
			ctrl1[i].Checked = False
	
	def checkAll(self, sender, event):
		ctrl1 = self.panel1.Controls
		count1 = ctrl1.Count
		for i in xrange(count1):
			ctrl1[i].Checked = True

l1 = tolist(IN[0])
if IN[1] == None: names = None
else: names = tolist(IN[1])

form = CheckBoxForm(IN[2])
y1 = 5
for i in xrange(len(l1)):
	try:
		if hasInd(names, i): val1 = names[i].ToString()
		else: val1 = l1[i].ToString()
		form.add_check(val1, y1, IN[3])
		y1 += 25
	except: pass
form.btn_adjust(y1)

Application.Run(form)
OUT = form.output1#, form.output2
Application.Exit()

Visualizing Collatz conjecture with Python

Collatz conjecture aka 3n+1 problem is notoriously famous for being the simplest to explain and yet unsolved problem in mathematics.

The problem goes like this: take any positive integer number; if it’s even – double the number, if it’s odd –triple it and add 1. Keep doing this to the new number you get until you finally reach 1. The conjecture is that after all these iterations, you always reach 1, no matter which positive integer you started from.

While no one has proved the conjecture, it has been verified for every number less than 268, which is more than 295 quintillion or 295 billion billion.

Here we are going to simulate this problem using Python. I’m using VS Code but you can prefer to use any IDE.

import matplotlib.pyplot as plt

num = int(input("Enter a positive integer: "))
seqList = [num]

while (num > 1):
    if num % 2 == 0:
        num = num/2
    else:
        num = 3 * num + 1
    seqList.append(num)   

print("Number of steps: ", len(seqList)-1)
print("Max step value: ", max(seqList))
print(seqList)

# Plotting graph
x = list(range(0,len(seqList)))

fig = plt.figure()
ax = fig.add_subplot(111)
ax.set_ylim(0,max(seqList)+5)

# x and y axis
plt.plot(x, seqList)

# Annotating graph
for i,j in zip(x, seqList):
    ax.annotate(str(j), xy=(i+0.1,j+0.5))

plt.xlabel("Number of steps")
plt.ylabel("Value")
plt.grid()
plt.show()
Number 27 unexpectedly hops up and down 111 times reaching a maximum higher than the elevation of Mt. Everest in meters. Interestingly, 27 is the only positive integer that is 3 times the sum of its digits.
Plot for number 15

Export Data to an Existing Excel Template

Ever wondered how to export data from Revit or any source for that matter to an existing Excel file where you already have some formatting done? It can be a bit winding task to first export your data to an intermediary blank Excel sheet and then copy/paste or link the cells or range to your original Excel template file.

This workflow here does not require any custom node or high-level coding — just a couple of out-of-the-box nodes to get your job done in a few seconds.

A sample Excel workbook with some formatting and formula applied
This Dynamo graph could be used in any Dynamo for Revit version. List.Combine acts as a function.
Output Excel sheet with the data filled in respective places

This is how you can save precious time to export data to any existing Excel file without making any modifications to the formatting. You can re-run the Dynamo script after changing input data in order to make any further changes.

Power BI and BIM Data Integration

Power BI is one of the most popular business analytics service out there to leverage your data to create attractive dynamic presentations of stats to visualize the trends better than every before.

Building “Information” Models are not far away in terms of getting the insights of your built asset to make informed decisions and provide productive insights into them.

Power BI can be used to do a number of things to get a better view at your building model.

  • Create elaborate reports and dashboards
  • Interactable 2D and 3D models with Forge Integration
  • Can consume COBie data
  • APIs exposed for developers for embedding dashboards in other software products
  • Data Visualization back to Revit as Landing page or send over to web-page

In the gif below, we have got a floor plan of a sample Revit model to get the information of Rooms into Power BI.

Some Applications of BIM Data

  • Design Analysis – Options generation
  • Asset Analysis
  • Space Analysis
  • Model Health Check
  • Project Progress Tracking
  • Forge Integration
  • Software usage
  • PC Metrics
  • Software License Usage
  • Financial Performance
3D interactive Building Model (Courtesy: powerbiblogic)

COVID-19 Dashboard with Interactive graphs (Courtesy: DataClue)

Text Case Changing in Revit

Dynamo can be used to perform basic text editing and formatting in bulk either in Autodesk Revit or any text information imported from other sources.

Image displaying changing the case of multiple text notes to Upper Case.

A simple dynamo workflow to change text case to lower case, upper case, title case, and separated by underscore.

Revit Worksets in Navisworks and Filtering Elements

Ever wondered how to filter out elements in Autodesk Navisworks Manage by their Revit worksets?

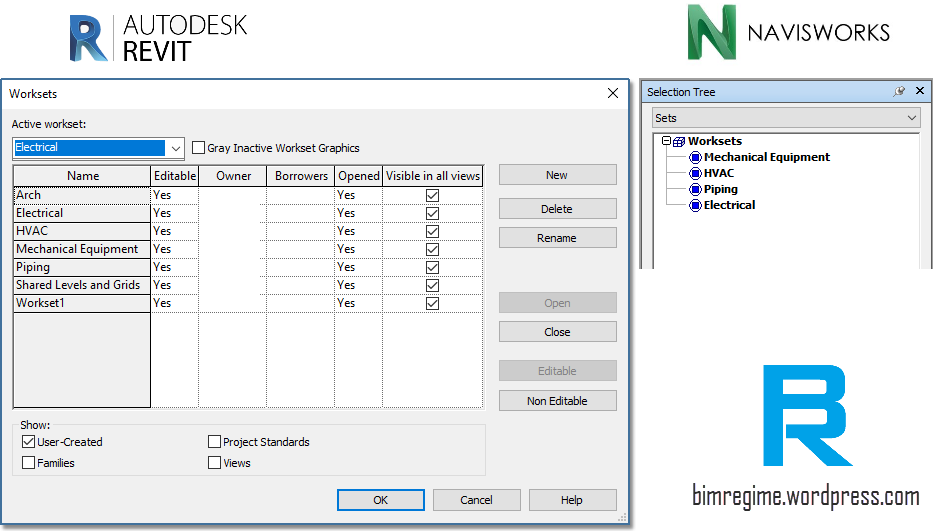
Worksets in Navisworks can give you greater control over your model data. You can perform various filtering, formatting on the worksets. It is also easier to extract parametric data out of Navisworks when you have clearly defined worksets.

Workset Selection Sets

Worksets in Revit

Worksets in Revit

Steps: 

  1. Export the 3D model in NWC format. Remember to keep the “Close NWC/NWD files on load” checkbox ticked while saving as *.nwc. Without this checked, the file lock is on and you cannot overwrite the file unless you close the current Navisworks file where it is appended to.

Exporting as NWC

Exporting as *.nwc

2. Append the file in Navisworks Manage. Select any element and right-click and make sure that the Set Selection Resolution is kept as the First Object. It will make the object path start at the highest level of objects below the layer node, if applicable.

Set Selection Resolution setting

Set Selection Resolution setting

3. You can see all the property data of the selected Revit element from the Properties panel in the Home ribbon. This is for our viewing purpose.

Properties in Navisworks

Properties in Navisworks

4. Now open Selection Tree panel (Ctrl+F12), and select Properties from the drop down menu.

As worksets are a property of the elements, go to Element > Workset.
Here you can find all the worksets (only those that contain elements) from your Revit project.

Worksets selection

Workset Selection

5. You can right-click and tick Hide Unselected to isolate the elements of the specific workset.

Click on Selection Inspector and it will show all the elements of that particular workset. Click Save Selection for all the entities in Workset.

Save worksets as set

Save Selection for Workset

Now you can find all the worksets under the Sets in the Selection Tree. All the filtering and sorting could be performed on these worksets.

Workset Selection Sets

Workset Section Sets

Tip: To sort or filter elements of different categories based on their parametric values Find Items is a pretty handy feature.

Go to View > Windows > Find Items

Find Items

Find Items for filtering

You can search in the already defined worksets or other selection sets to narrow down the filtering.

Revit Warnings Messages

Mitigating warnings in Revit could be a pretty daunting task. It can severely impact your model in a long run if left unchecked.

You can find all the warnings pertaining to your current project under
Manage tabInquiry panel (Review Warnings)

This tool is not enabled if there are no warning messages.

Warnings in Revit

These warnings could essentially be divided into three severity levels.

1. Ignorable: Warnings that are primarily informative and can be ignored.

2. Serious: Can be ignored but should be addressed in due course.

3. Critical: Must be resolved to keep the file functioning properly. You can find warning elements by their element ID number.

Listed below are all possible Revit warning types that could creep up in a Revit model or family environment.
e.g. A warning of type Elements have duplicate “Value” values could manifest itself in the form of Elements have duplicate “Mark” values in a project.
Continue reading →

Modify Revit Families and Family Types with Dynamo

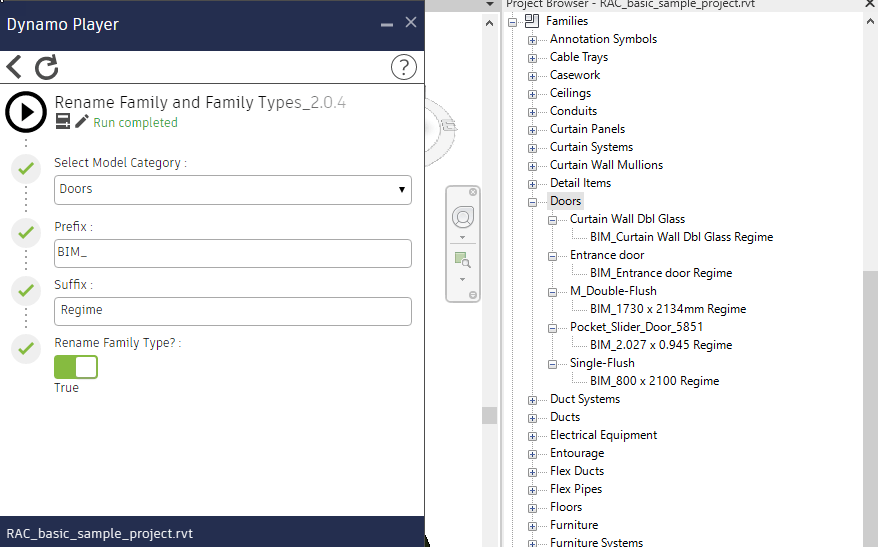
So, today we’re going to see a simple yet handy Dynamo workflow to rename a bunch of families in your Revit project using Dynamo player.

Now this Dynamo graph combines two routines — to add prefix and/or suffix to either families (loadable) or family types.

Family Rename Graph

We have set all our 4 input nodes as inputs in Dynamo and it’s ready to go in Dynamo player.
Don’t forget to load the required packages. Browse the script in Dynamo player and edit the inputs.

Family Types Rename

The prefix or suffix fields could be kept empty in case you don’t want any one of them. The boolean input could toggle between modifying family name or family type name.

Family Rename