Working with Type Parameters can be a bit challenging in Dynamo for beginners and on top of that working with multiple elements and their parameters. Today we are going to look at how to set the multiple type parameters for each of the various families in the project.
Type parameters are specific to a family type, and we need to obtain the family type to access its parameters. Setting parameters for multiple elements can be achieved in a similar manner.
Revit is a powerful tool for building design and construction, but with great power comes great responsibility. Keeping your Revit projects tidy and efficient can be a daunting task, especially when it comes to purging unwanted elements. Revit does come with an out-of-the-box feature Purge Unwanted to purge items, but it doesn’t allow bulk deleting of custom-picked elements.
To solve this problem, we can turn to Dynamo, a visual programming platform that allows us to automate tasks in Revit. By creating a Dynamo script or workflow, we can first get all the materials used in the project and then let the user pick the elements or materials that need to be deleted. The script filters out the selected materials and deletes them in bulk.
List.FilterBySelection from Springs package
Delete Unwanted Materials Dynamo Graph
By creating our own Dynamo workflows around this, we can delete other unplaced elements in bulk, such as views, floor plans, sections, legends, schedules, spaces, rooms, scope boxes, imported files, and more.
By using Dynamo to automate the process of purging unwanted elements in Revit, we can save time and improve the efficiency of our workflow. So why not give it a try and see how it can streamline your Revit projects?
Python 1: Get All Materials This piece of code retrieves all the material elements and their names in the project.
# Import the necessary packages
import clr
clr.AddReference('RevitAPI')
from Autodesk.Revit.DB import *
clr.AddReference('RevitServices')
from RevitServices.Persistence import DocumentManager

# Get the Revit document
doc = DocumentManager.Instance.CurrentDBDocument

# Get all the materials in the project
materials = FilteredElementCollector(doc).OfClass(Material)
mats = FilteredElementCollector(doc).OfClass(Material).ToElements()
# Create lists to store the material names and IDs
material_names = []
material_ids = []

# Loop through the materials and retrieve their names and IDs
for material in materials:
    material_names.append(str(material.Id) + " - " + material.Name)

# Define the outputs
OUT = mats, material_names
Python 2: Filter List
The Python 2: Filter List node is taken from the List.FilterBySelection custom node by spring nodes by Dimitar Venkov. This Python code defines a custom form with checkboxes that allow the user to select elements. The code adds references to the necessary libraries, defines a few functions, and then creates the form using the CheckBoxForm class. The form includes buttons to check or uncheck all the elements, and to save the selected elements. This code can be used in Dynamo scripts to enable user selection of elements for further processing.
Collatz conjecture aka 3n+1 problem is notoriously famous for being the simplest to explain and yet unsolved problem in mathematics.
The problem goes like this: take any positive integer number; if it’s even – double the number, if it’s odd –triple it and add 1. Keep doing this to the new number you get until you finally reach 1. The conjecture is that after all these iterations, you always reach 1, no matter which positive integer you started from.
While no one has proved the conjecture, it has been verified for every number less than268, which is more than 295 quintillion or 295 billion billion.
Here we are going to simulate this problem using Python. I’m using VS Code but you can prefer to use any IDE.
import matplotlib.pyplot as plt

num = int(input("Enter a positive integer: "))
seqList = [num]

while (num > 1):
    if num % 2 == 0:
        num = num/2
    else:
        num = 3 * num + 1
    seqList.append(num)

print("Number of steps: ", len(seqList)-1)
print("Max step value: ", max(seqList))
print(seqList)

# Plotting graph
x = list(range(0,len(seqList)))

fig = plt.figure()
ax = fig.add_subplot(111)
ax.set_ylim(0,max(seqList)+5)

# x and y axis
plt.plot(x, seqList)

# Annotating graph
for i,j in zip(x, seqList):
    ax.annotate(str(j), xy=(i+0.1,j+0.5))

plt.xlabel("Number of steps")
plt.ylabel("Value")
plt.grid()
plt.show()
Number 27 unexpectedly hops up and down 111 times reaching a maximum higher than the elevation of Mt. Everest in meters. Interestingly, 27 is the only positive integer that is 3 times the sum of its digits.
Power BI is one of the most popular business analytics service out there to leverage your data to create attractive dynamic presentations of stats to visualize the trends better than every before.
Building “Information” Models are not far away in terms of getting the insights of your built asset to make informed decisions and provide productive insights into them.
Power BI can be used to do a number of things to get a better view at your building model.
Create elaborate reports and dashboards
Interactable 2D and 3D models with Forge Integration
Can consume COBie data
APIs exposed for developers for embedding dashboards in other software products
Data Visualization back to Revit as Landing page or send over to web-page
In the gif below, we have got a floor plan of a sample Revit model to get the information of Rooms into Power BI.
Many times when you are creating MEP models in Revit using native rfa families, it would be required to split the piping or ducting into some standard lengths based on the project requirement. This could be quite a tedious manual process to measure and split the pipes/ducts especially when it comes to sloped piping the exact standard split length seems to be hard to achieve.
This Dynamo workflow helps you to split Pipe or Duct networks into optimal Manufacturer’s lengths in Revit. Just run the script in Dynamo or Dynamo Player and select the model in a Revit view. It will auto-detect all the piping/ducting and split them into user-specified lengths. You can anytime make adjustments to the selection method.
Supported Versions Revit 2017, 2018, 2019, 2020, 2021 Dynamo 2.0.4 and above
WordPress compresses images, so the above picture might not be legible. Please see the screenshots in two parts below. Right click on the image and select ‘Open image in new tab’.
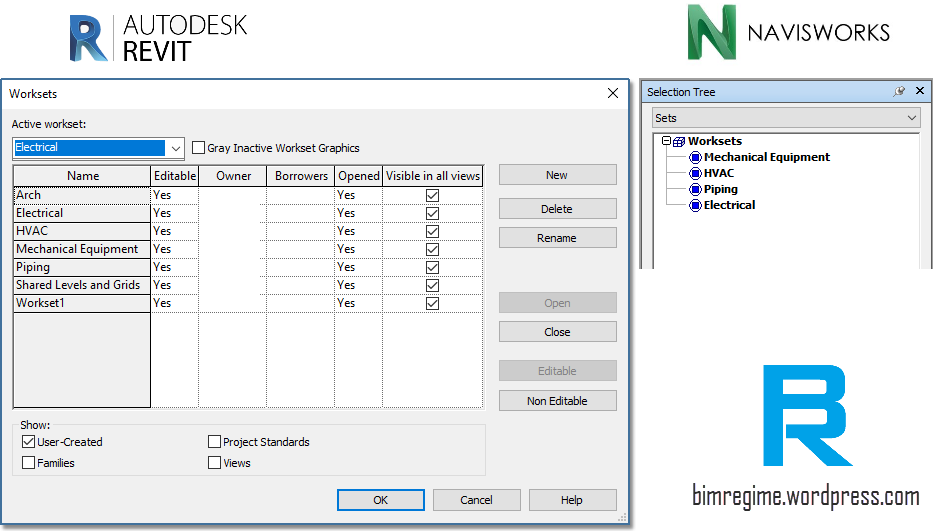
Ever wondered how to filter out elements in Autodesk Navisworks Manage by their Revit worksets?
Worksets in Navisworks can give you greater control over your model data. You can perform various filtering, formatting on the worksets. It is also easier to extract parametric data out of Navisworks when you have clearly defined worksets.
Worksets in Revit
Steps:
Export the 3D model in NWC format. Remember to keep the “Close NWC/NWD files on load” checkbox ticked while saving as *.nwc. Without this checked, the file lock is on and you cannot overwrite the file unless you close the current Navisworks file where it is appended to.
Exporting as *.nwc
2. Append the file in Navisworks Manage. Select any element and right-click and make sure that the Set Selection Resolution is kept as the First Object. It will make the object path start at the highest level of objects below the layer node, if applicable.
Set Selection Resolution setting
3. You can see all the property data of the selected Revit element from the Properties panel in the Home ribbon. This is for our viewing purpose.
Properties in Navisworks
4. Now open Selection Tree panel (Ctrl+F12), and select Properties from the drop down menu.
As worksets are a property of the elements, go to Element > Workset.
Here you can find all the worksets (only those that contain elements) from your Revit project.
Workset Selection
5. You can right-click and tick Hide Unselected to isolate the elements of the specific workset.
Click on Selection Inspector and it will show all the elements of that particular workset. Click Save Selection for all the entities in Workset.
Save Selection for Workset
Now you can find all the worksets under the Sets in the Selection Tree. All the filtering and sorting could be performed on these worksets.
Workset Section Sets
Tip: To sort or filter elements of different categories based on their parametric values Find Items is a pretty handy feature.
Go to View > Windows > Find Items
Find Items for filtering
You can search in the already defined worksets or other selection sets to narrow down the filtering.
Mitigating warnings in Revit could be a pretty daunting task. It can severely impact your model in a long run if left unchecked.
You can find all the warnings pertaining to your current project under
Manage tabInquiry panel (Review Warnings)
This tool is not enabled if there are no warning messages.
These warnings could essentially be divided into three severity levels.
1. Ignorable: Warnings that are primarily informative and can be ignored.
2. Serious: Can be ignored but should be addressed in due course.
3. Critical: Must be resolved to keep the file functioning properly. You can find warning elements by their element ID number.
Listed below are all possible Revit warning types that could creep up in a Revit model or family environment.
e.g. A warning of type Elements have duplicate “Value” values could manifest itself in the form of Elements have duplicate “Mark” values in a project. Continue reading →
STL and OBJ files have become a standard in the 3D printing industry. Many 3D modeling and computer graphics programs such as Autodesk Maya, Blender, Sketchup, Cinema 4D can produce these models in a pretty nifty manner.
For color 3D printing with precise mesh encoding, OBJ files prove to be a useful format while preserving the precise mesh encoding. You may get yourself a free 3D model from Oyonale.
You can see the 3D model in any free 3D object viewer. The 3D Viewer from Microsoft is a great application that comes with Windows 10.


 (Review Warnings)


